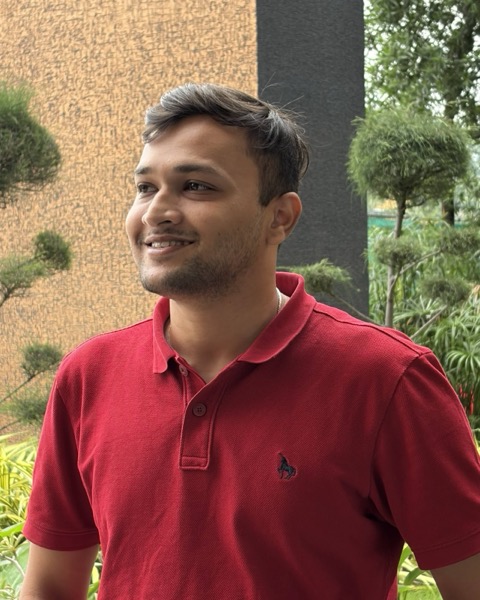
Karan Mittal
- Data visualisation expert
- Co-founder and CTO, Dextar
- Organiser, ML Indore and GDG Cloud Indore
I’ve built data apps in Plotly Dash since 2019, including a year as a software engineer at Plotly. After that I built analytics for semiconductor manufacturing at Lam Research and for oncology teams in life sciences.
What I build
Most of my work starts with data that’s hard to read and ends with something a team opens every week.
Dashboards your team can run
Plotly Dash and Streamlit apps on your own data, built so your team can change them after I leave.
Charts that explain a model
Evaluation results and errors drawn so people outside the ML team can see where a model fails.
Views of connected data
Knowledge graphs and networks laid out so you can follow one record to the next.
The charts use illustrative data.
Writing and talks



OpenAI Codex vs Claude Code: Which AI Coding Agent Wins in 2026?
A systems-level comparison of coding-agent harnesses: context assembly, execution boundaries, memory, supervision and review workflow.
Stop Wasting GPU VRAM — PagedAttention & vLLM Architecture
Led the group through the PagedAttention paper (Kwon et al., SOSP 2023): how vLLM pages the KV cache like virtual memory instead of reserving GPU memory for it up front.
Agentverse: The Scholar's Grimoire — Building Knowledge Engines with RAG
A hands-on session on building deterministic retrieval systems with GraphRAG, ADK and Neo4j.
What needs to work better?
Describe the data, who relies on it and what they need to see. A few sentences are enough to start.